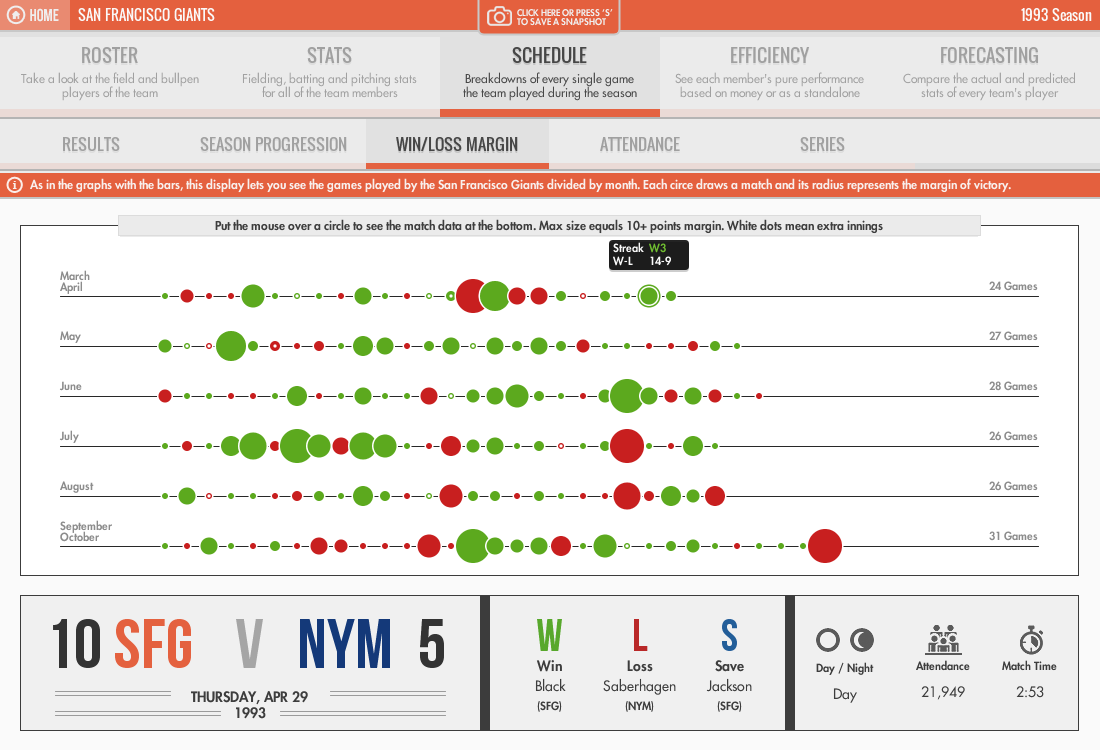
Sports data are usually stored in databases and made avail- able as plain tables that, in the best of the cases, allow the users to sort them by a given column. Although this technique is the most used to show the present state of a competition or its final outcome, it does not provide all of the information an analyst may require. Hence, this work aims to provide a new method of visualizing full seasons of base- ball by means of a heatmap that holds every game of the season in it. Taking advantage of filtering and interaction, we explore the possibility of overlapping seasons to provide a deeper analysis of teams’ results over selected time spans.
Snapshots
Video