NCBI Molluska taxonomy
Visualization of the NCBI taxonomy for mollusca (from http://www.phyloxml.org), with more than 8000 nodes. Note that, in this case, branch lengths do not have a special meaning
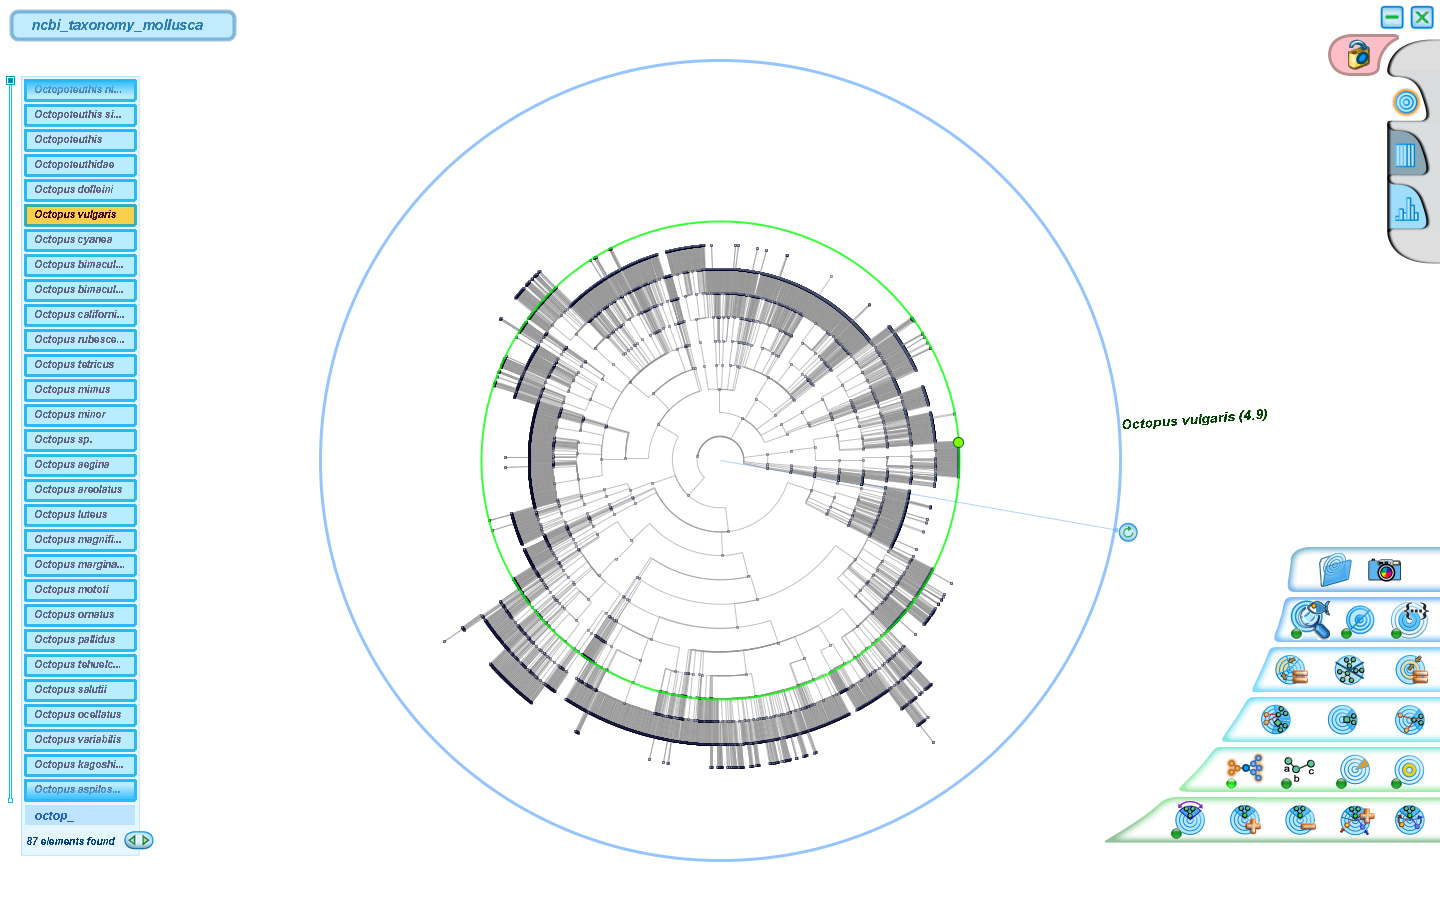
Octopus vulgaris has been searched with the left bottom text box, and highlighted in the dendrogram.

The Octopodiformes family has been separated as a different sector occupying half the circle
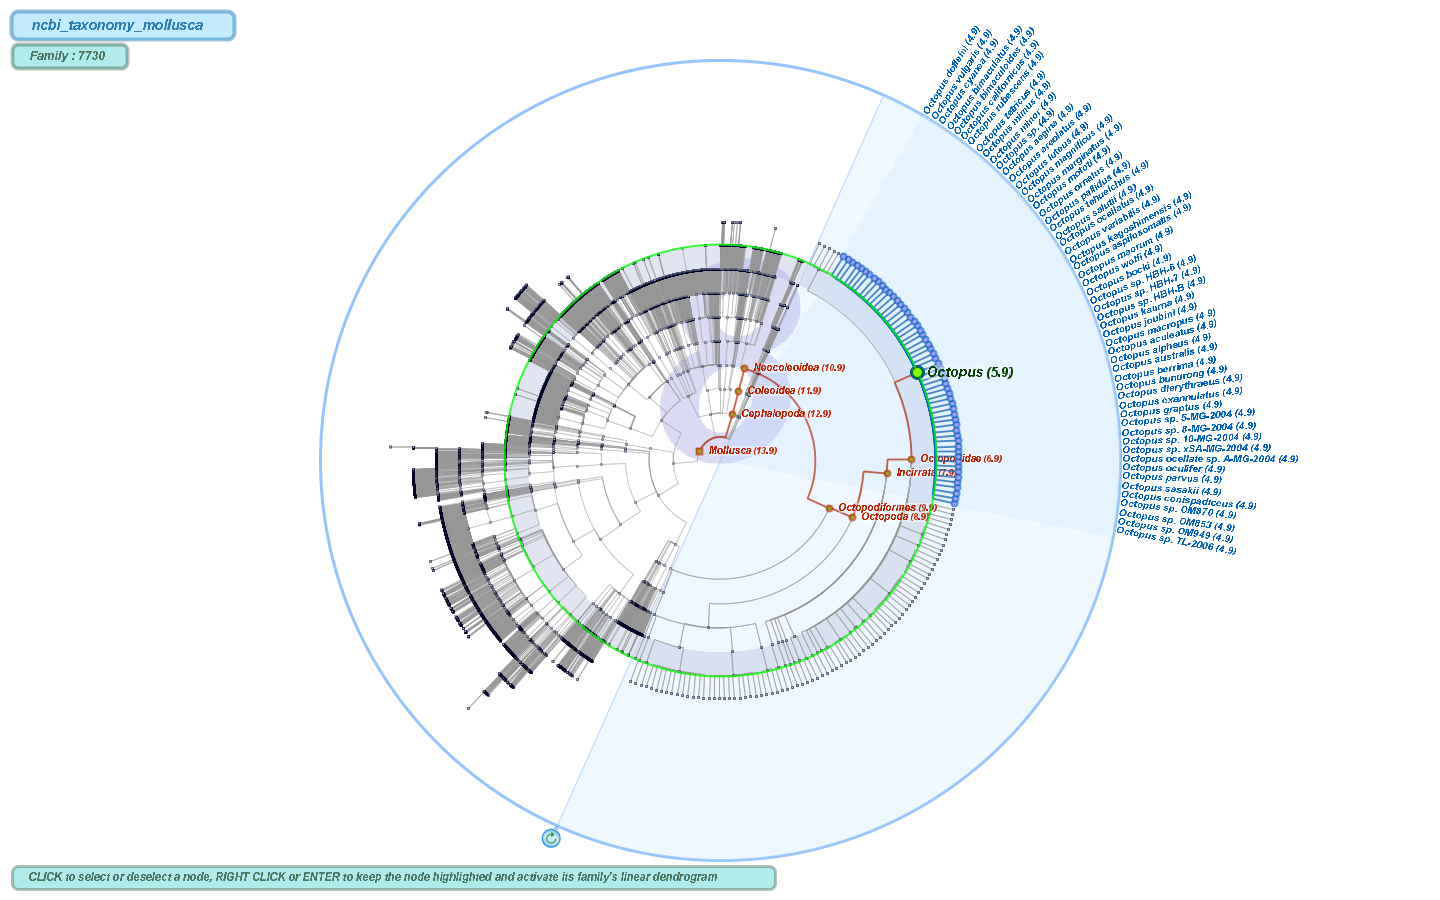
Octopus subfamily
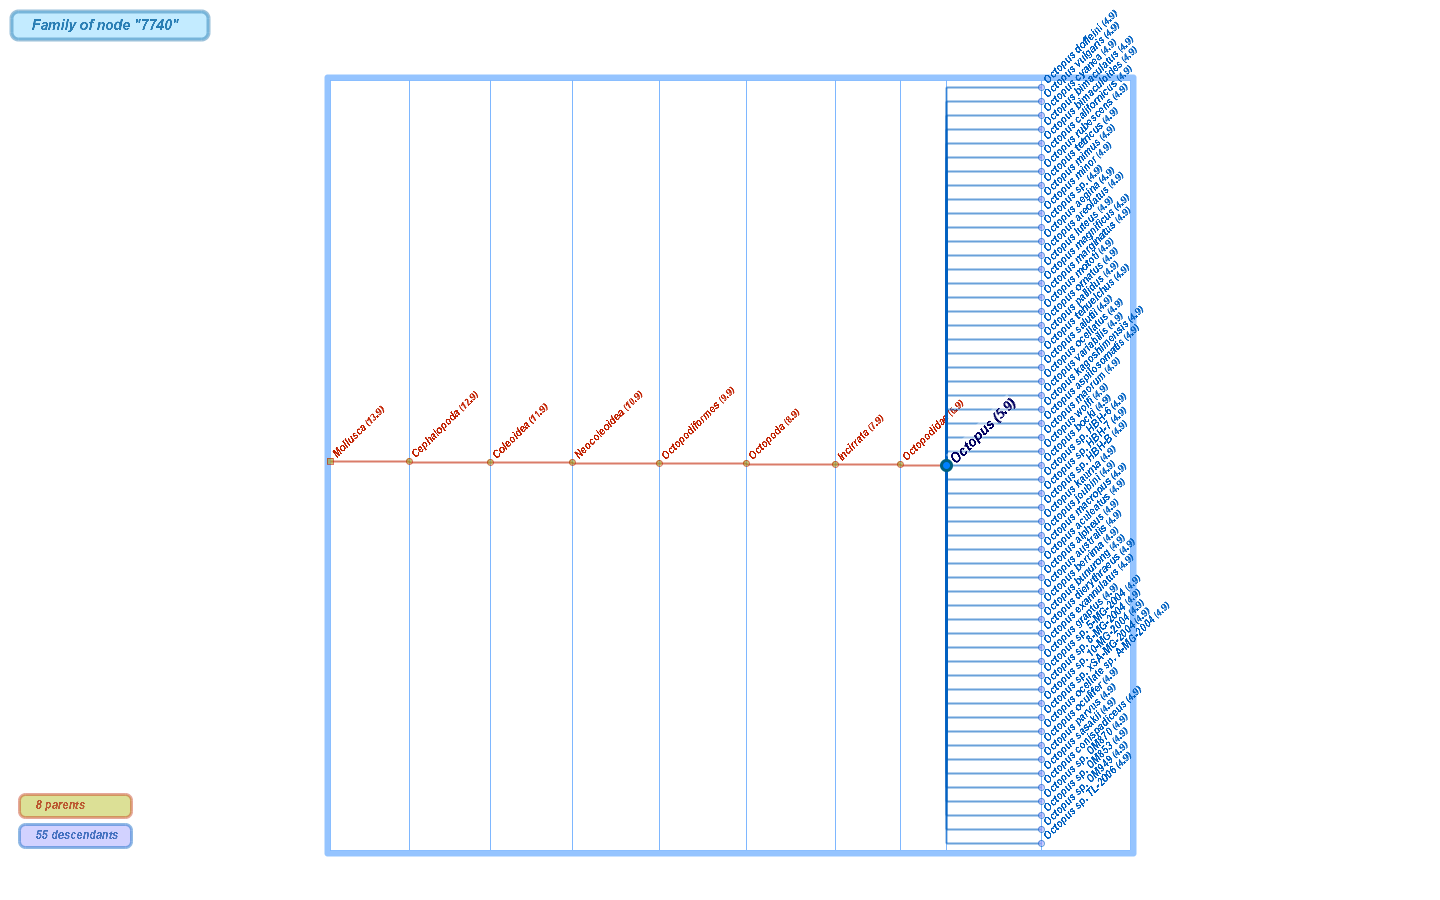
Octopus subfamily in the linear visualization
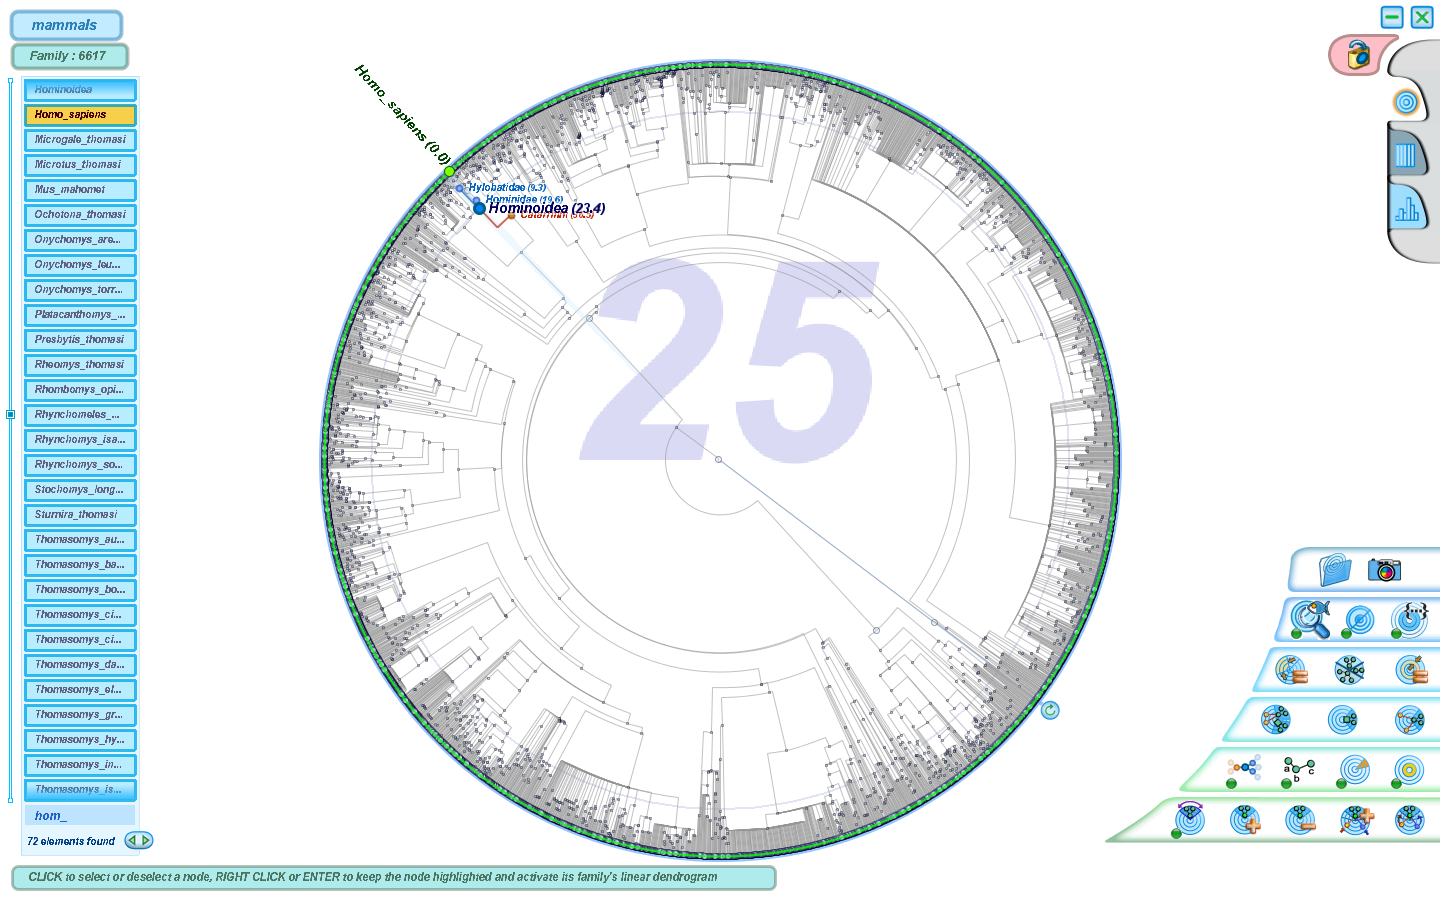
Initial visualization plus search for Homo sapiens.
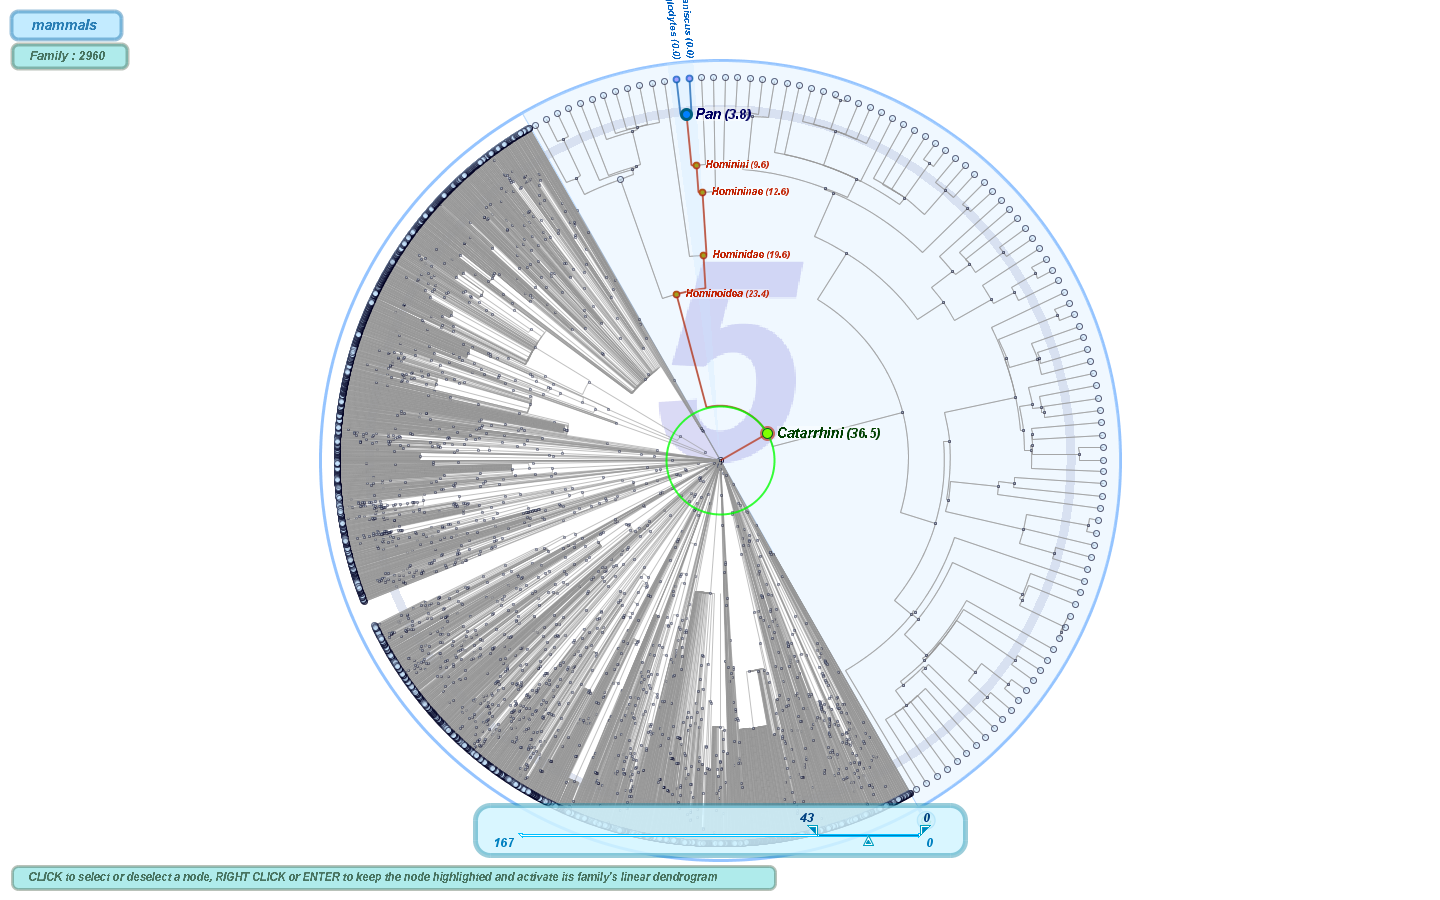
The full path to Pan subfamily. The family of Catarrhini has been expanded without losin the context of the rest of the tree, and the interval of time from 167 to 44 Myrs. ago has been filtered out.
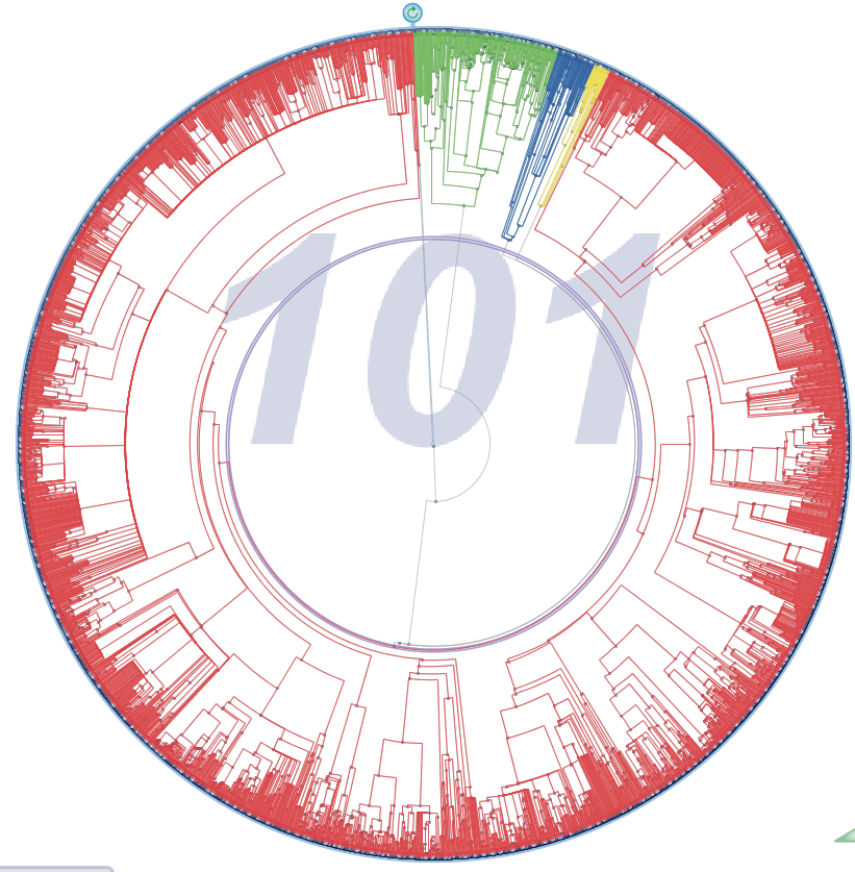

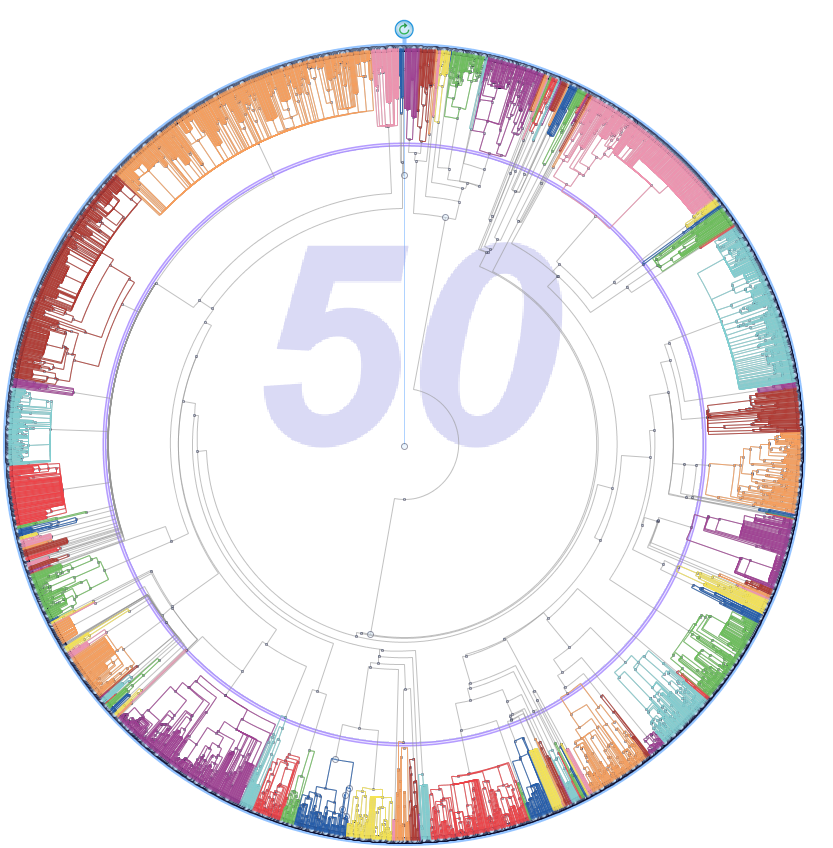
Comparison of the existing mammal families at different times. At 101 Myrs. (left) there are only four families. At 65 Myrs. near the C/T boundary (center) there are much more diversity, but it is some Myrs. later (right) when the diversification boosts, specially on some families such as the red one at the top-left quarter of the central figure.
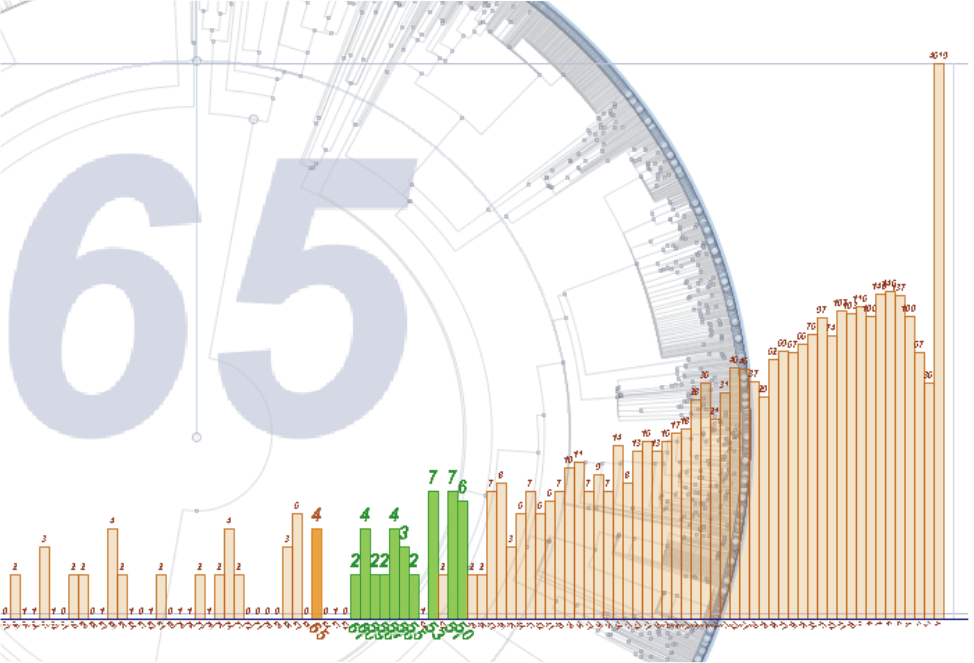
Detail of a histogram showing the number of branches per Myr. At 65 Myrs. (orange bar) there is some evolutionary activity, but this becomes more constant when it approaches to 50 Myrs (green bars)
Similarity trees
These are some snapshots of Treevolution's visualization of similarity trees coming from genetic information. The visualization of some special characteristics such as branch confidence, gene sequences, etc. is still under research, so this are just preliminary representations.
.PNG)
Example from apoptosis domains (data from phyloxml.org). The number of nodes is low (61) and now branch lengths do not represent time.
Branch transparency represents the bootstrap value or confidence of the branch (the more transparent, the less confident). Domains are besides labels.
.PNG)
Bcl-2 gene family tree. A larger tree, but also with bootstrap values. Branch events (duplication, speciation) are represented by color (green, red)
.PNG)
Amphibiam tree of life with about 1000 nodes (data from phyloxml.org). Every internal node has two childs, branch lengths are constant, and there are no confidence values