|
||||||
| Home | Intro | Gallery | Video | Credits | ||
|
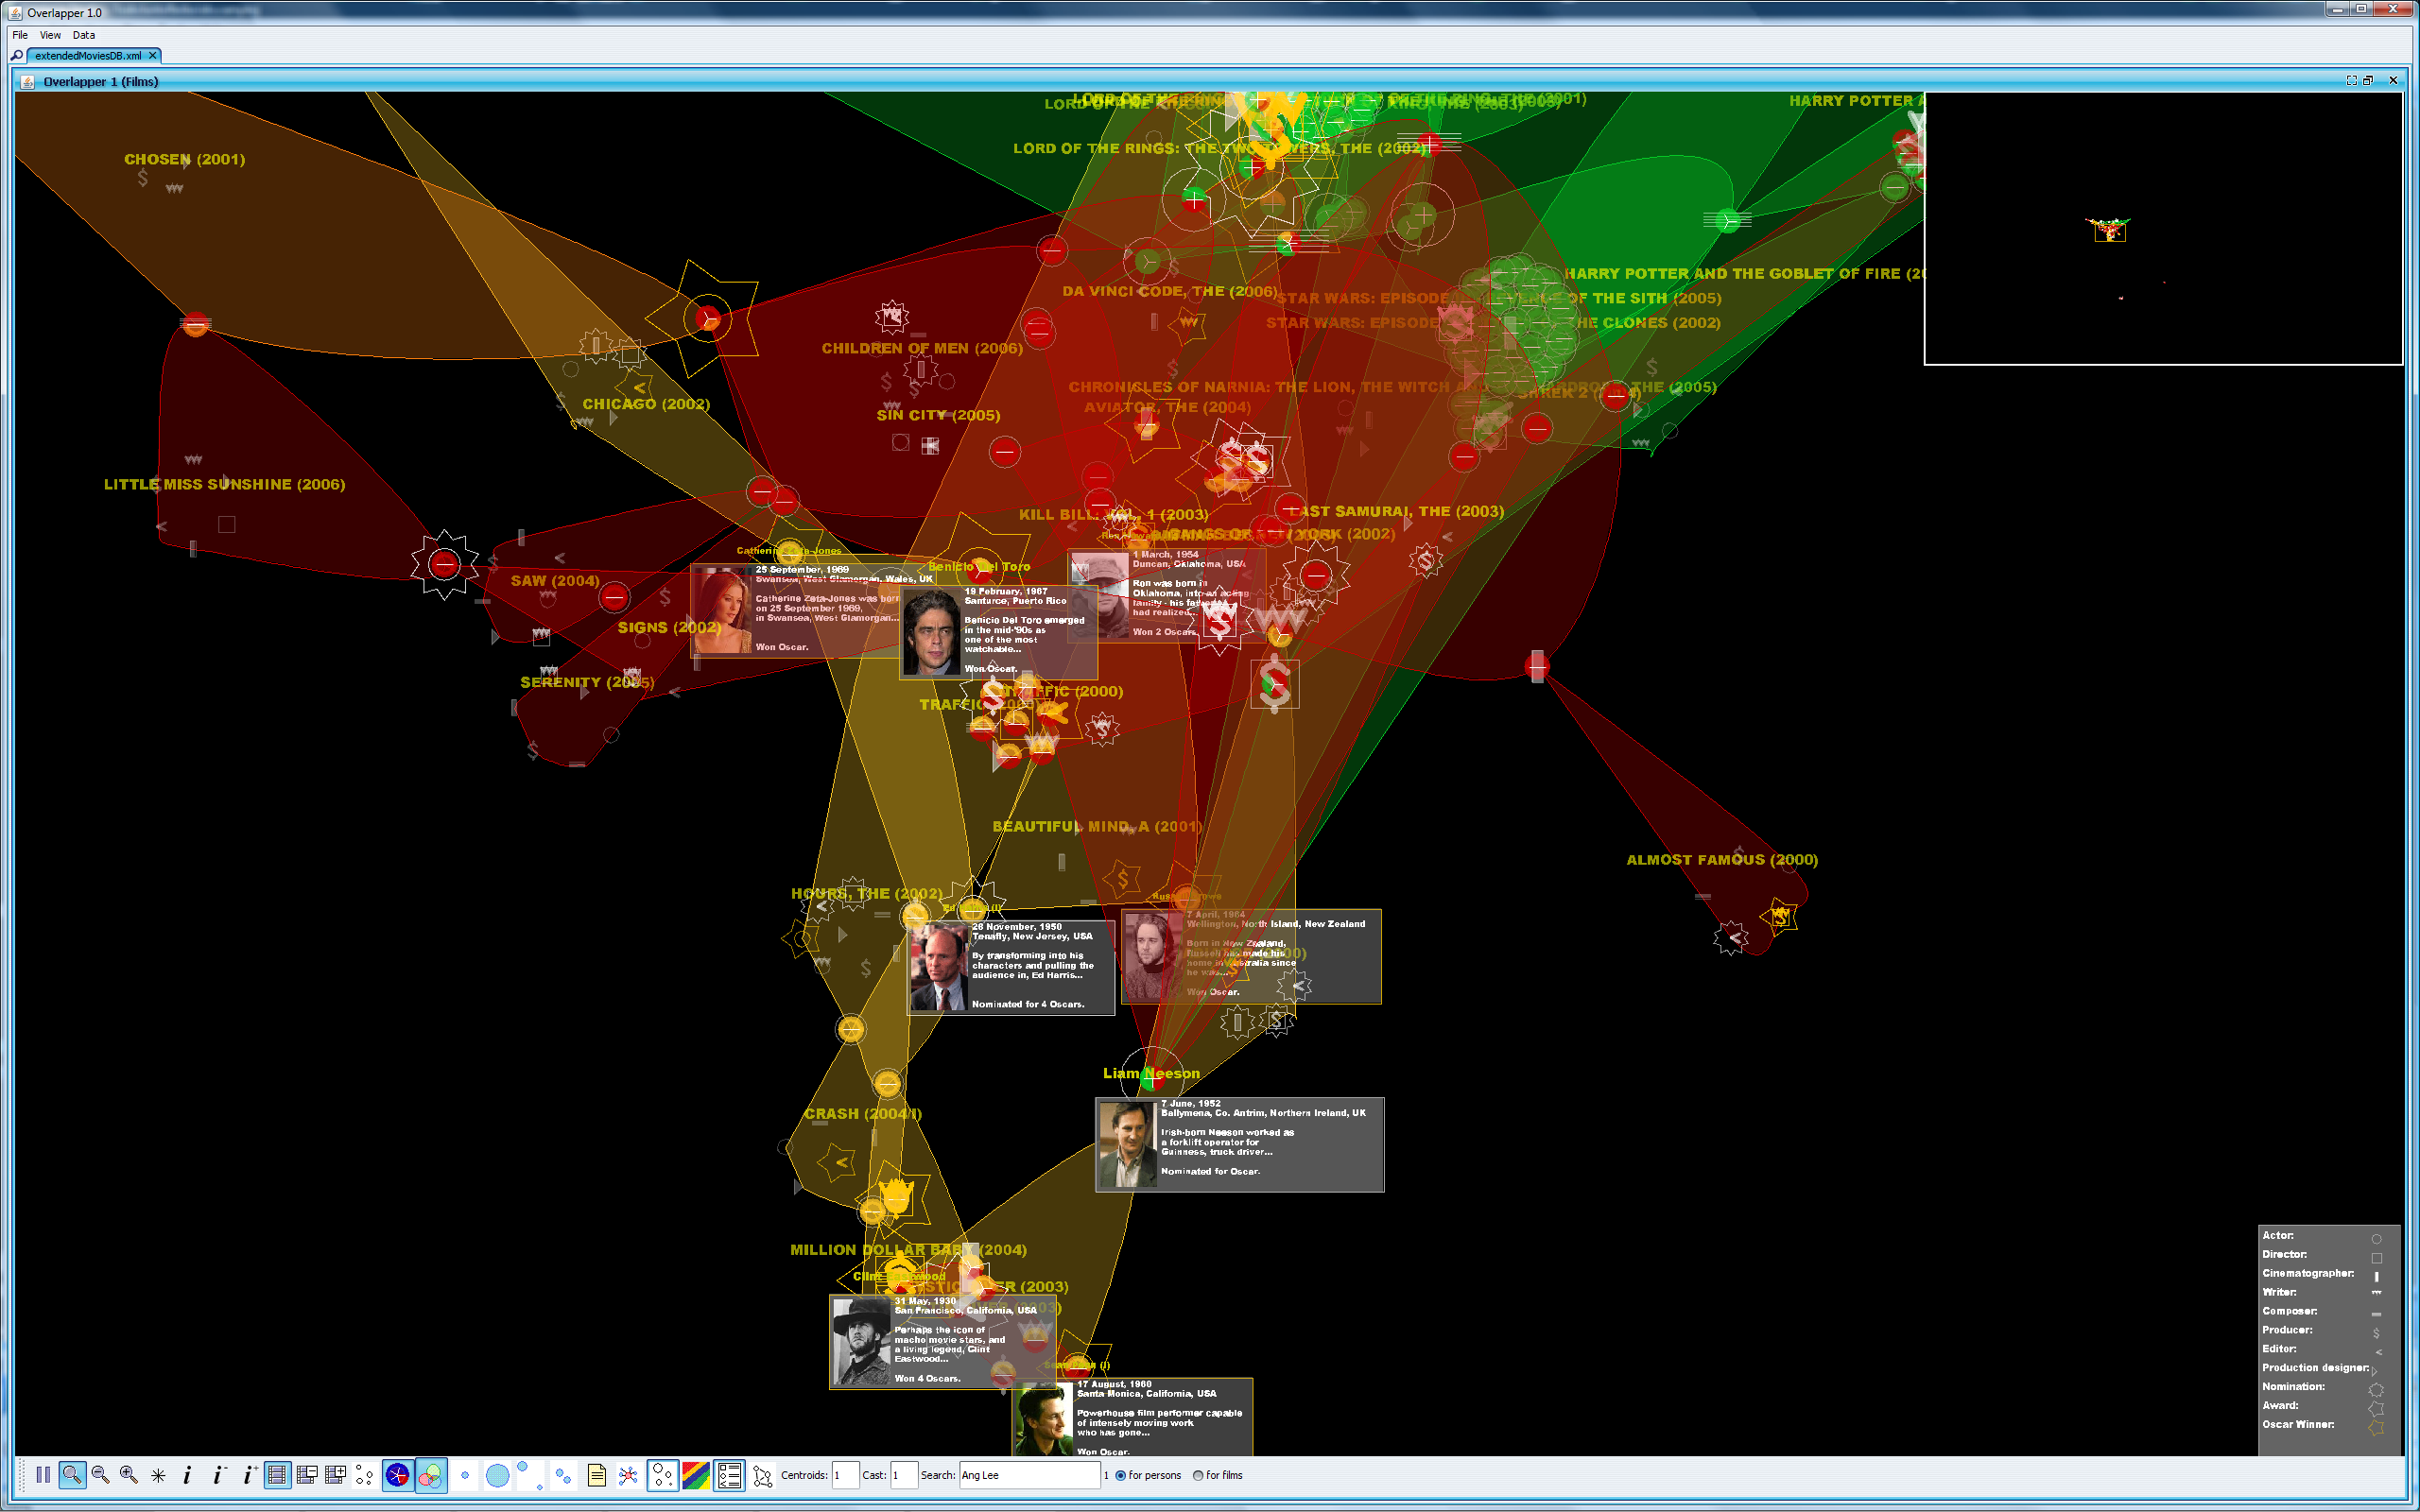
The OverlapperThe Overlapper is an extended social network representation that focus in very connected groups (as could be persons related to a film) and overlapping between different networks. This tool is developed using a modified force-directed graph representing people as nodes, and all the people involved in a movie are joint together in a kind of bubble (surrounded by a hull), resulting in an environment full of bubbles interconnected by people involved in more than one film. Two important drawacks of graph visualization are complexity and cluttering. Complexity is reduced by selecting only interesting subsets so only relevant information will be displayed. Also we have used two edge models: the complete model join together all nodes of each film, while the radial model just connects each person node to a central node representing the movie, reducing edge complexity. To avoid cluttering, edges are not drawn. Instead, transparent hulls group persons involved in a film together. Nodes can be visualized as pie charts, divided in as much sections as movies in which the node is involved. Each of these sections are colored following the data sub-selection to which it belongs. For example in the image below, Benicio del Toro has a pie chart divided in three sections, two red and one yellow, indicating that he worked in three films corresponding to two different subsets. This is a great help in the understanding of the overlapping selections. The shape of the node (glyph) represents roles and awards for persons in each movie. Glyphs have been chosen in a way that its overlapping does not clutter information, inspired by spanish bull's brands.
|